Featured
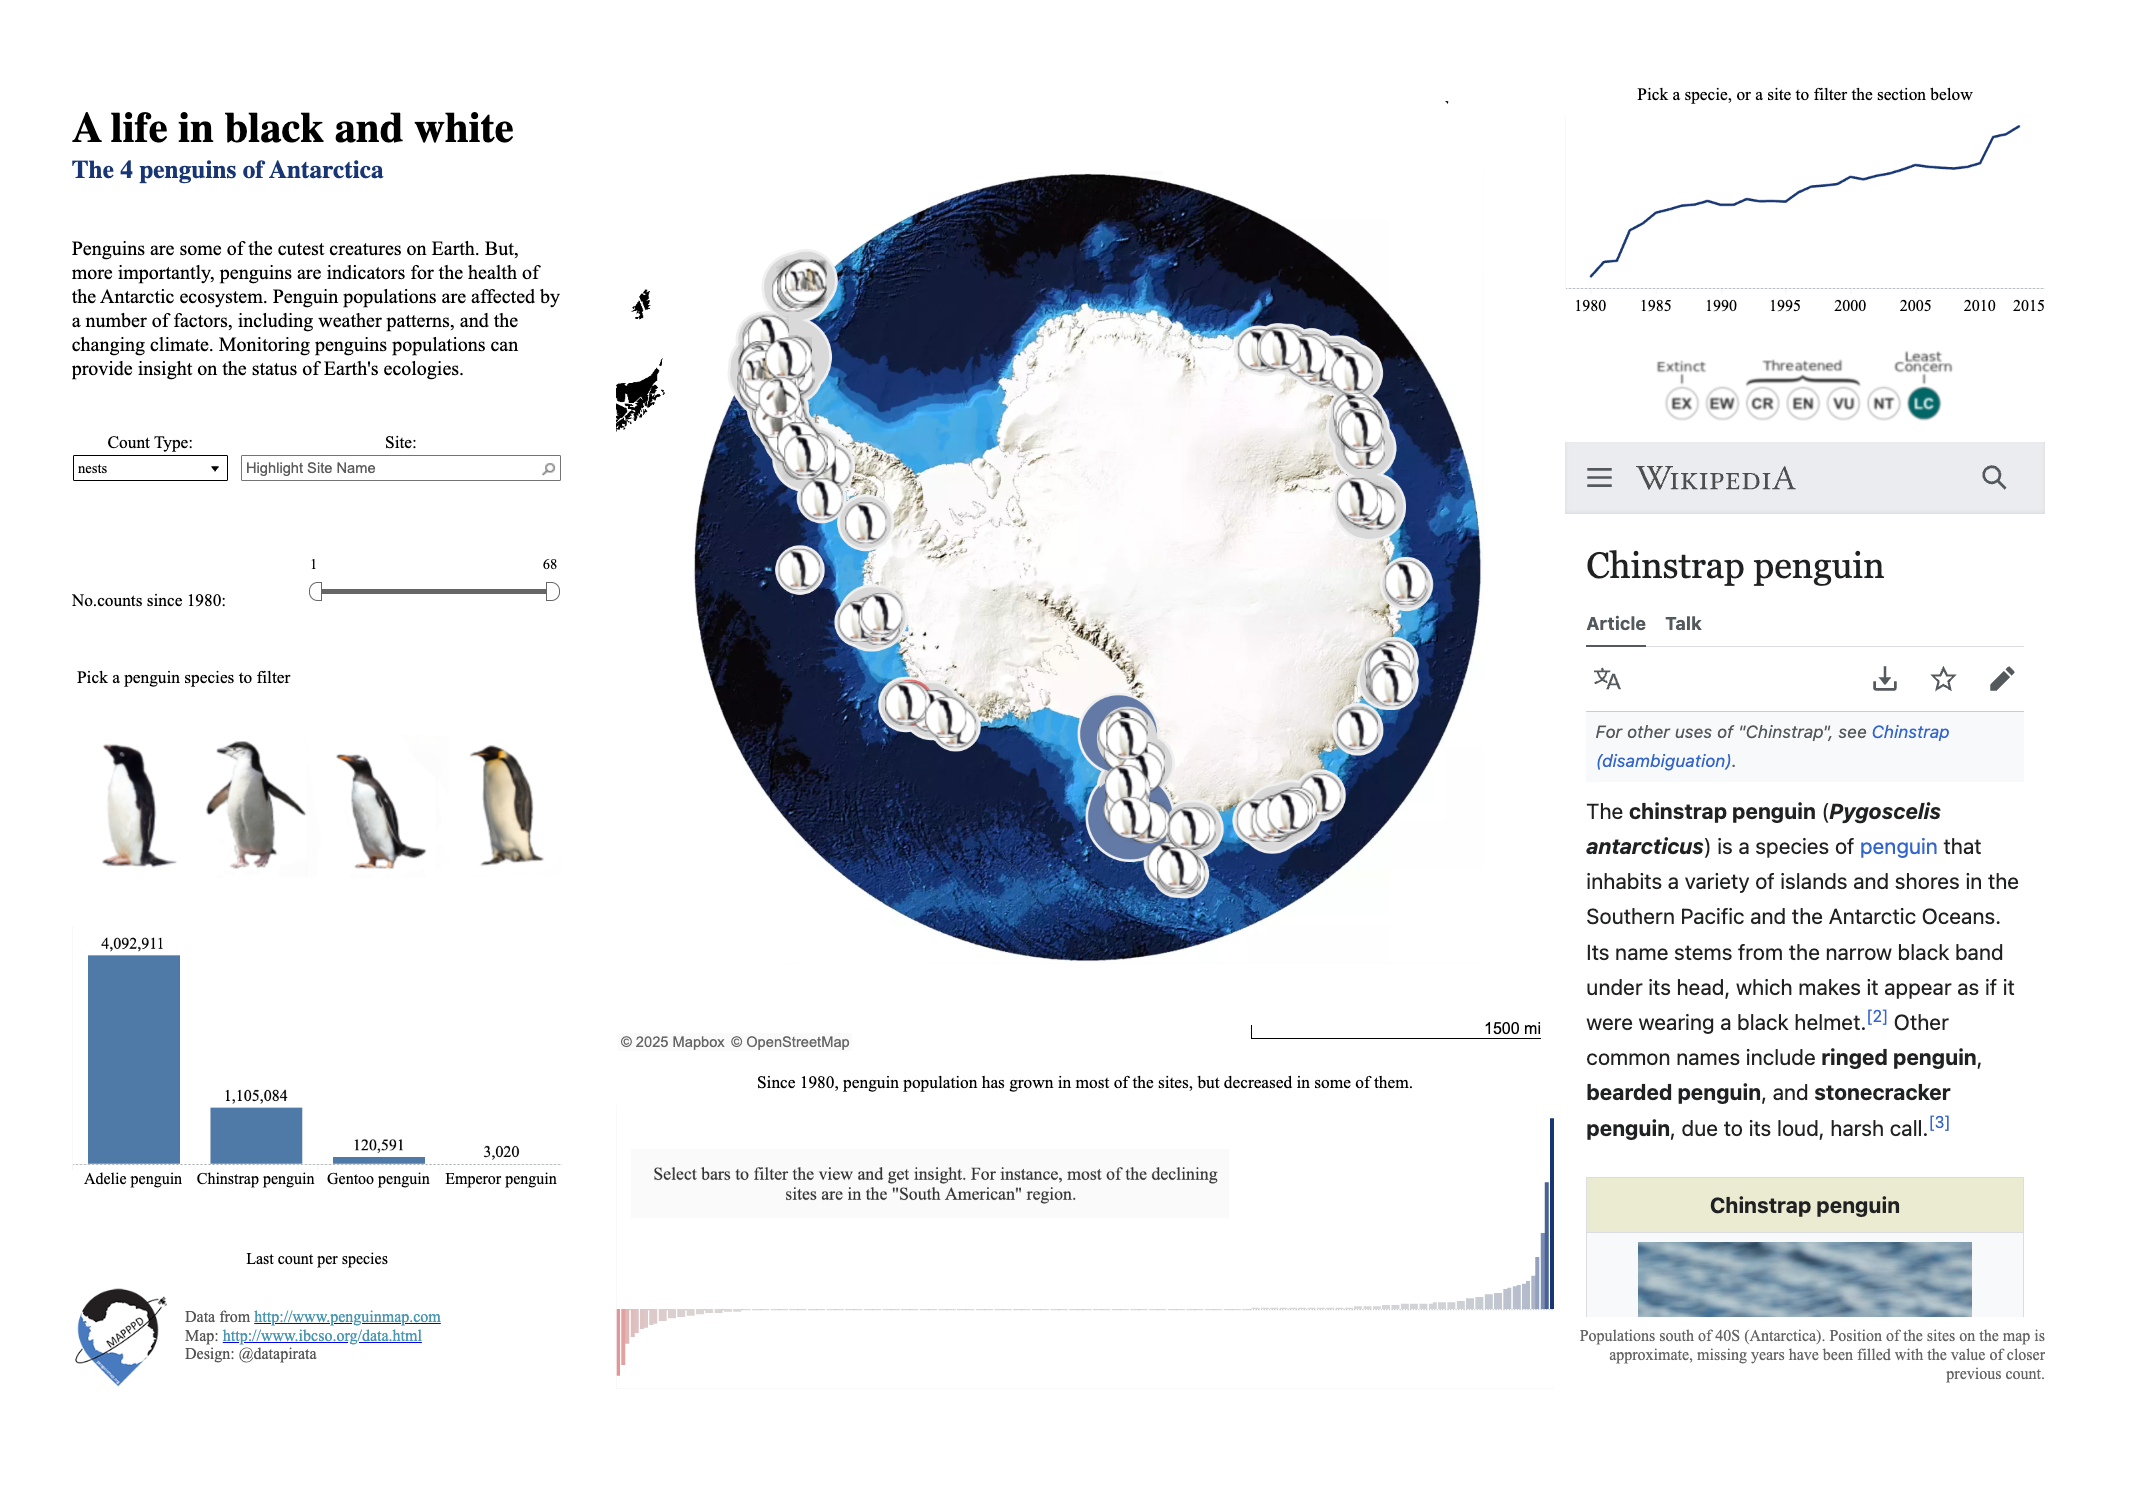
A life in black and white
It’s that time of the year again, when Tableau hosts another round of the #IronViz competition. This time the topic is “Safari”: Animals & Plants....

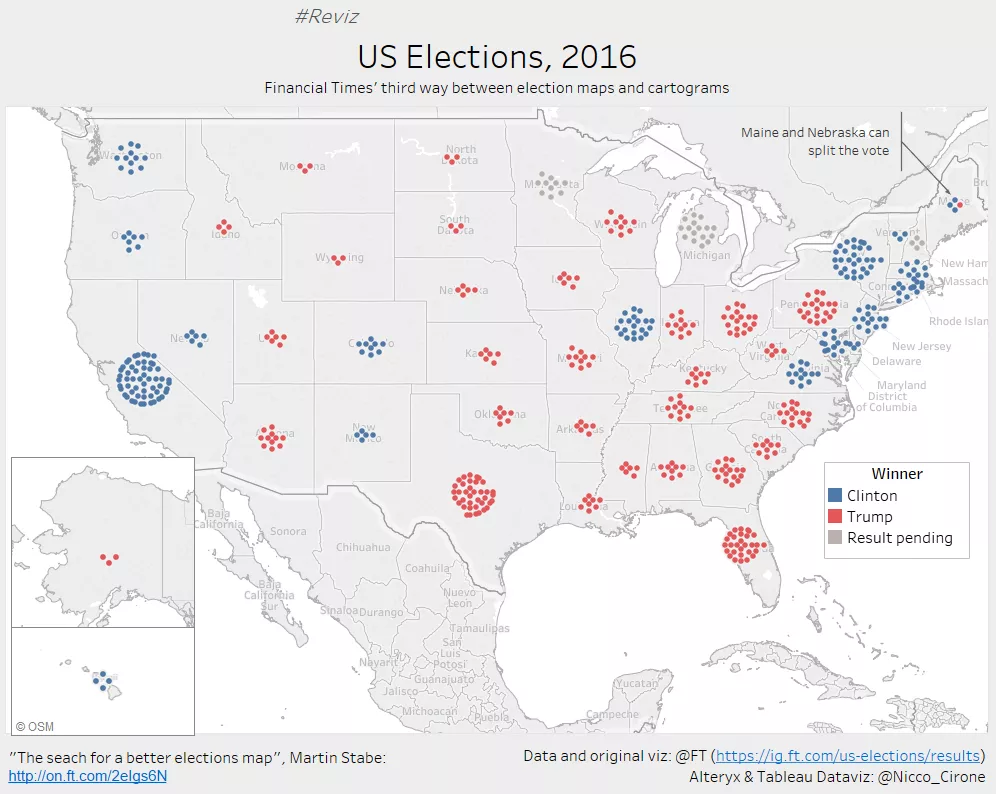
#ReViz: FT's new map for visualizing US elections
On Tuesday, the world wake up with a new POTUS, and the media were filled with data visualizations of the result. An electoral dataviz that never gets...
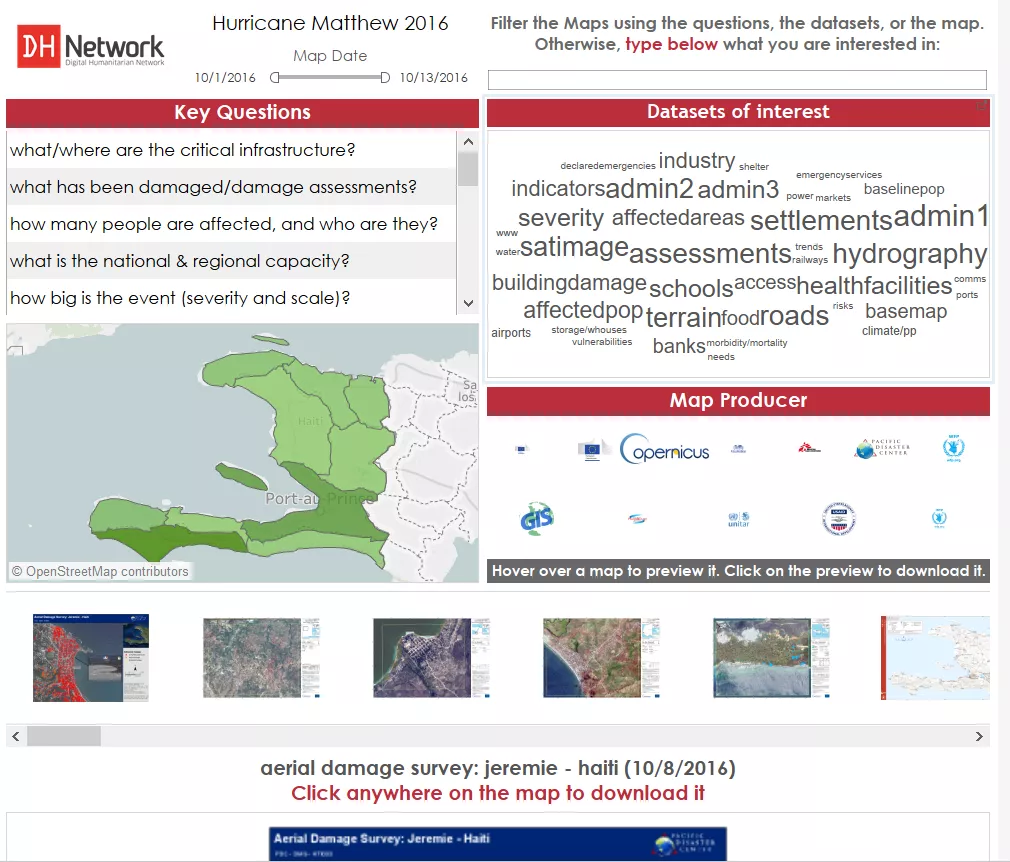
Humanitarian Response Map Review - Helping disaster relief using Alteryx and Tableau
At the beginning of this year, I decided to get involved in the Tableau Foundation Service Corps: a group of people volunteering for charities and...
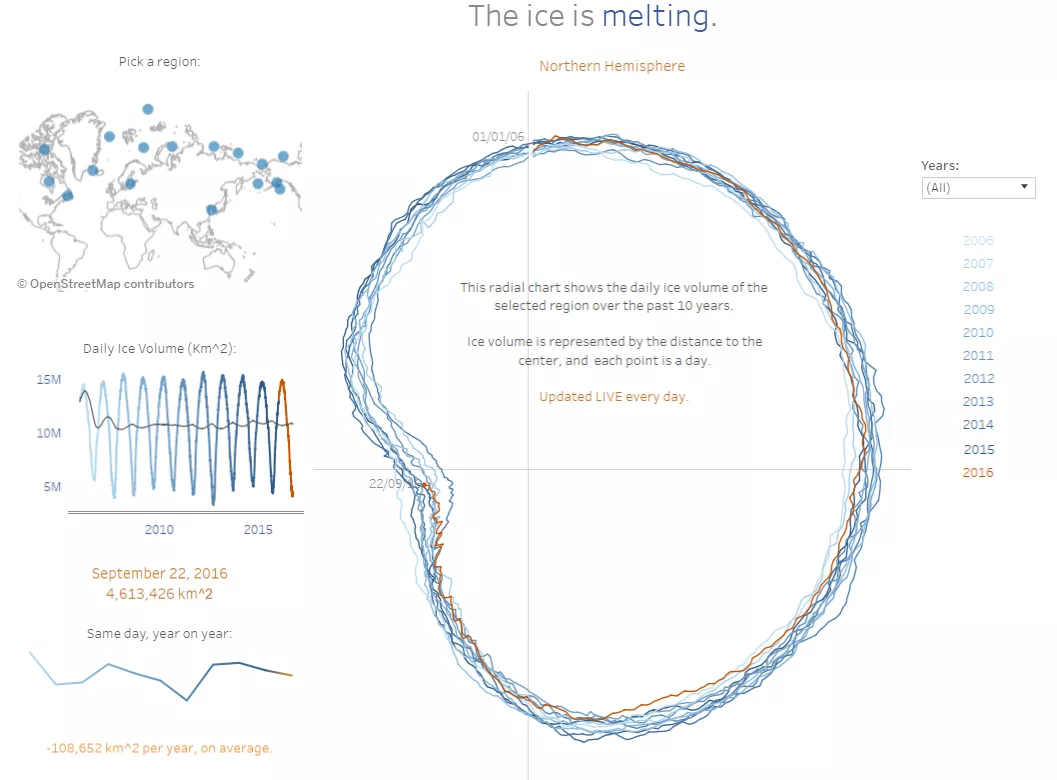
The ice is melting. Monitoring the world's ice with a radial chart.
For this third and last Tableau #IronViz qualification round (follow the link and find my dataviz, if you want to vote for me!), I decided to...
All Stories
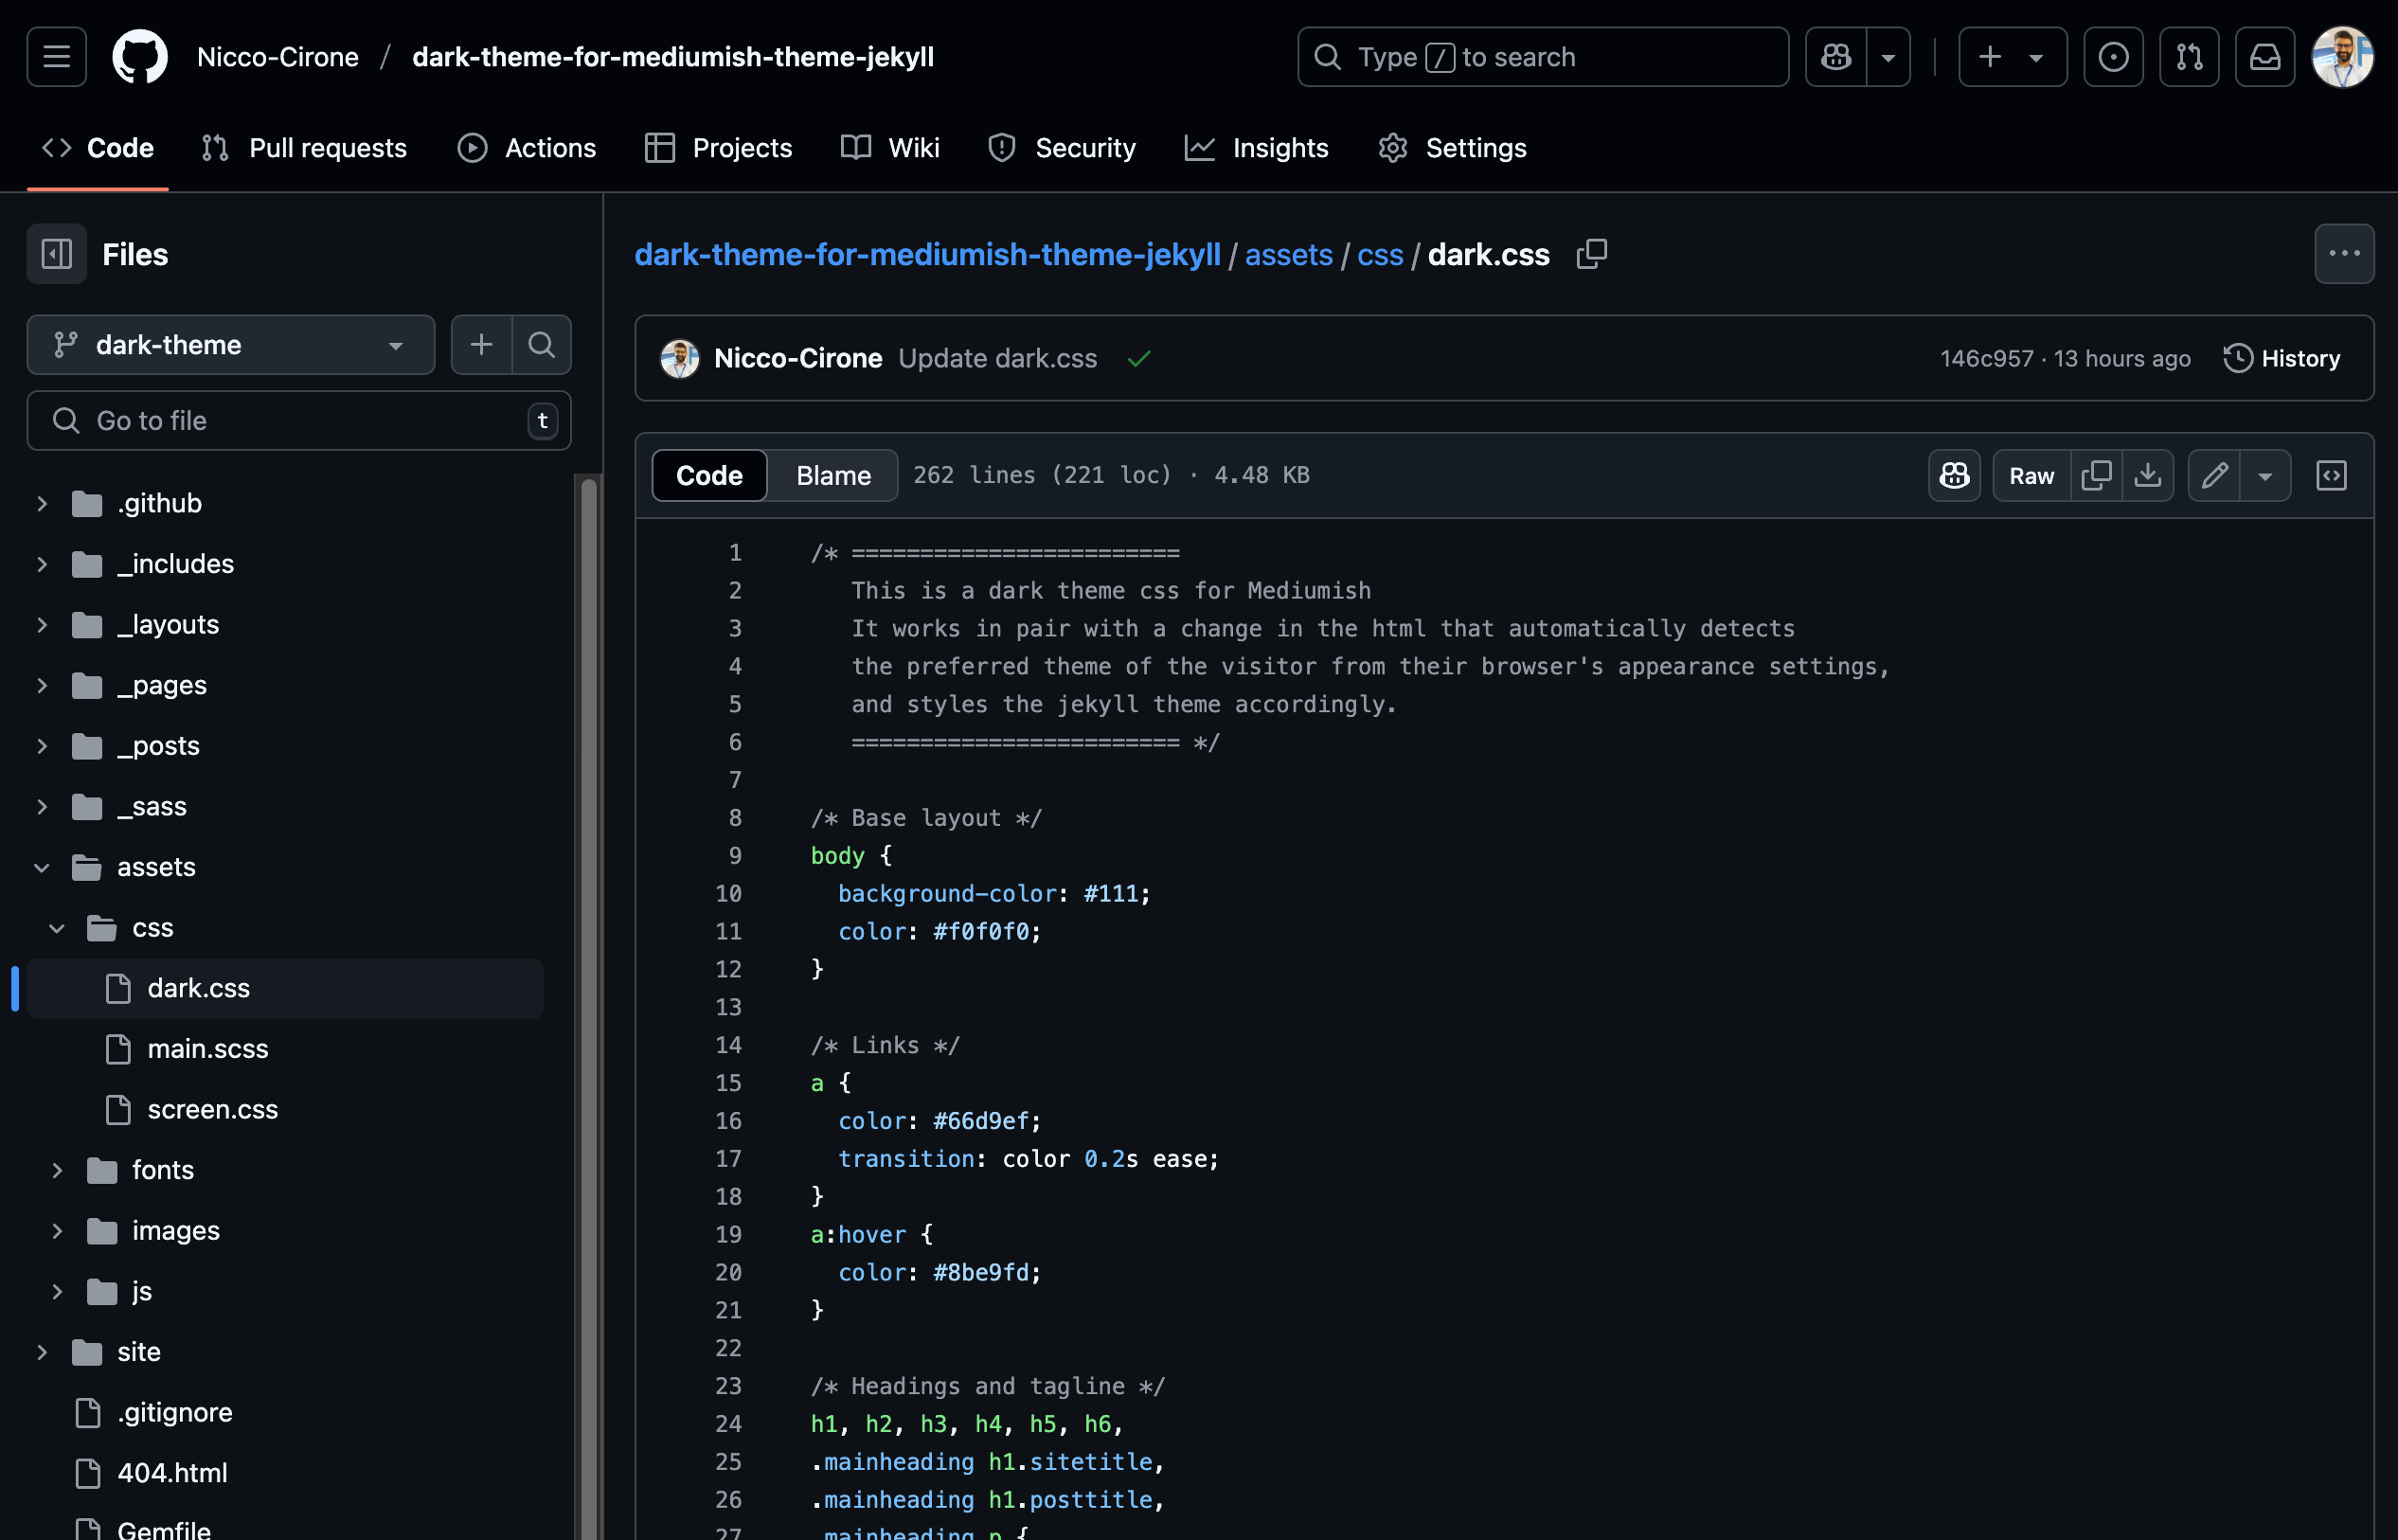
Automated Dark Mode for my Jekyll Theme: My first Github fork
I like dark mode. Not because it’s trendy, but because it feels right. It’s easier on the eyes, especially when you’re reading or writing late. It saves battery. It’s good...
Building a Blog from Zero with Jekyll and Github Pages
In June 2025, I set out to migrate my old blog from WordPress.com to a fast, clean, static site built with Jekyll and hosted on GitHub Pages. My goal: have...
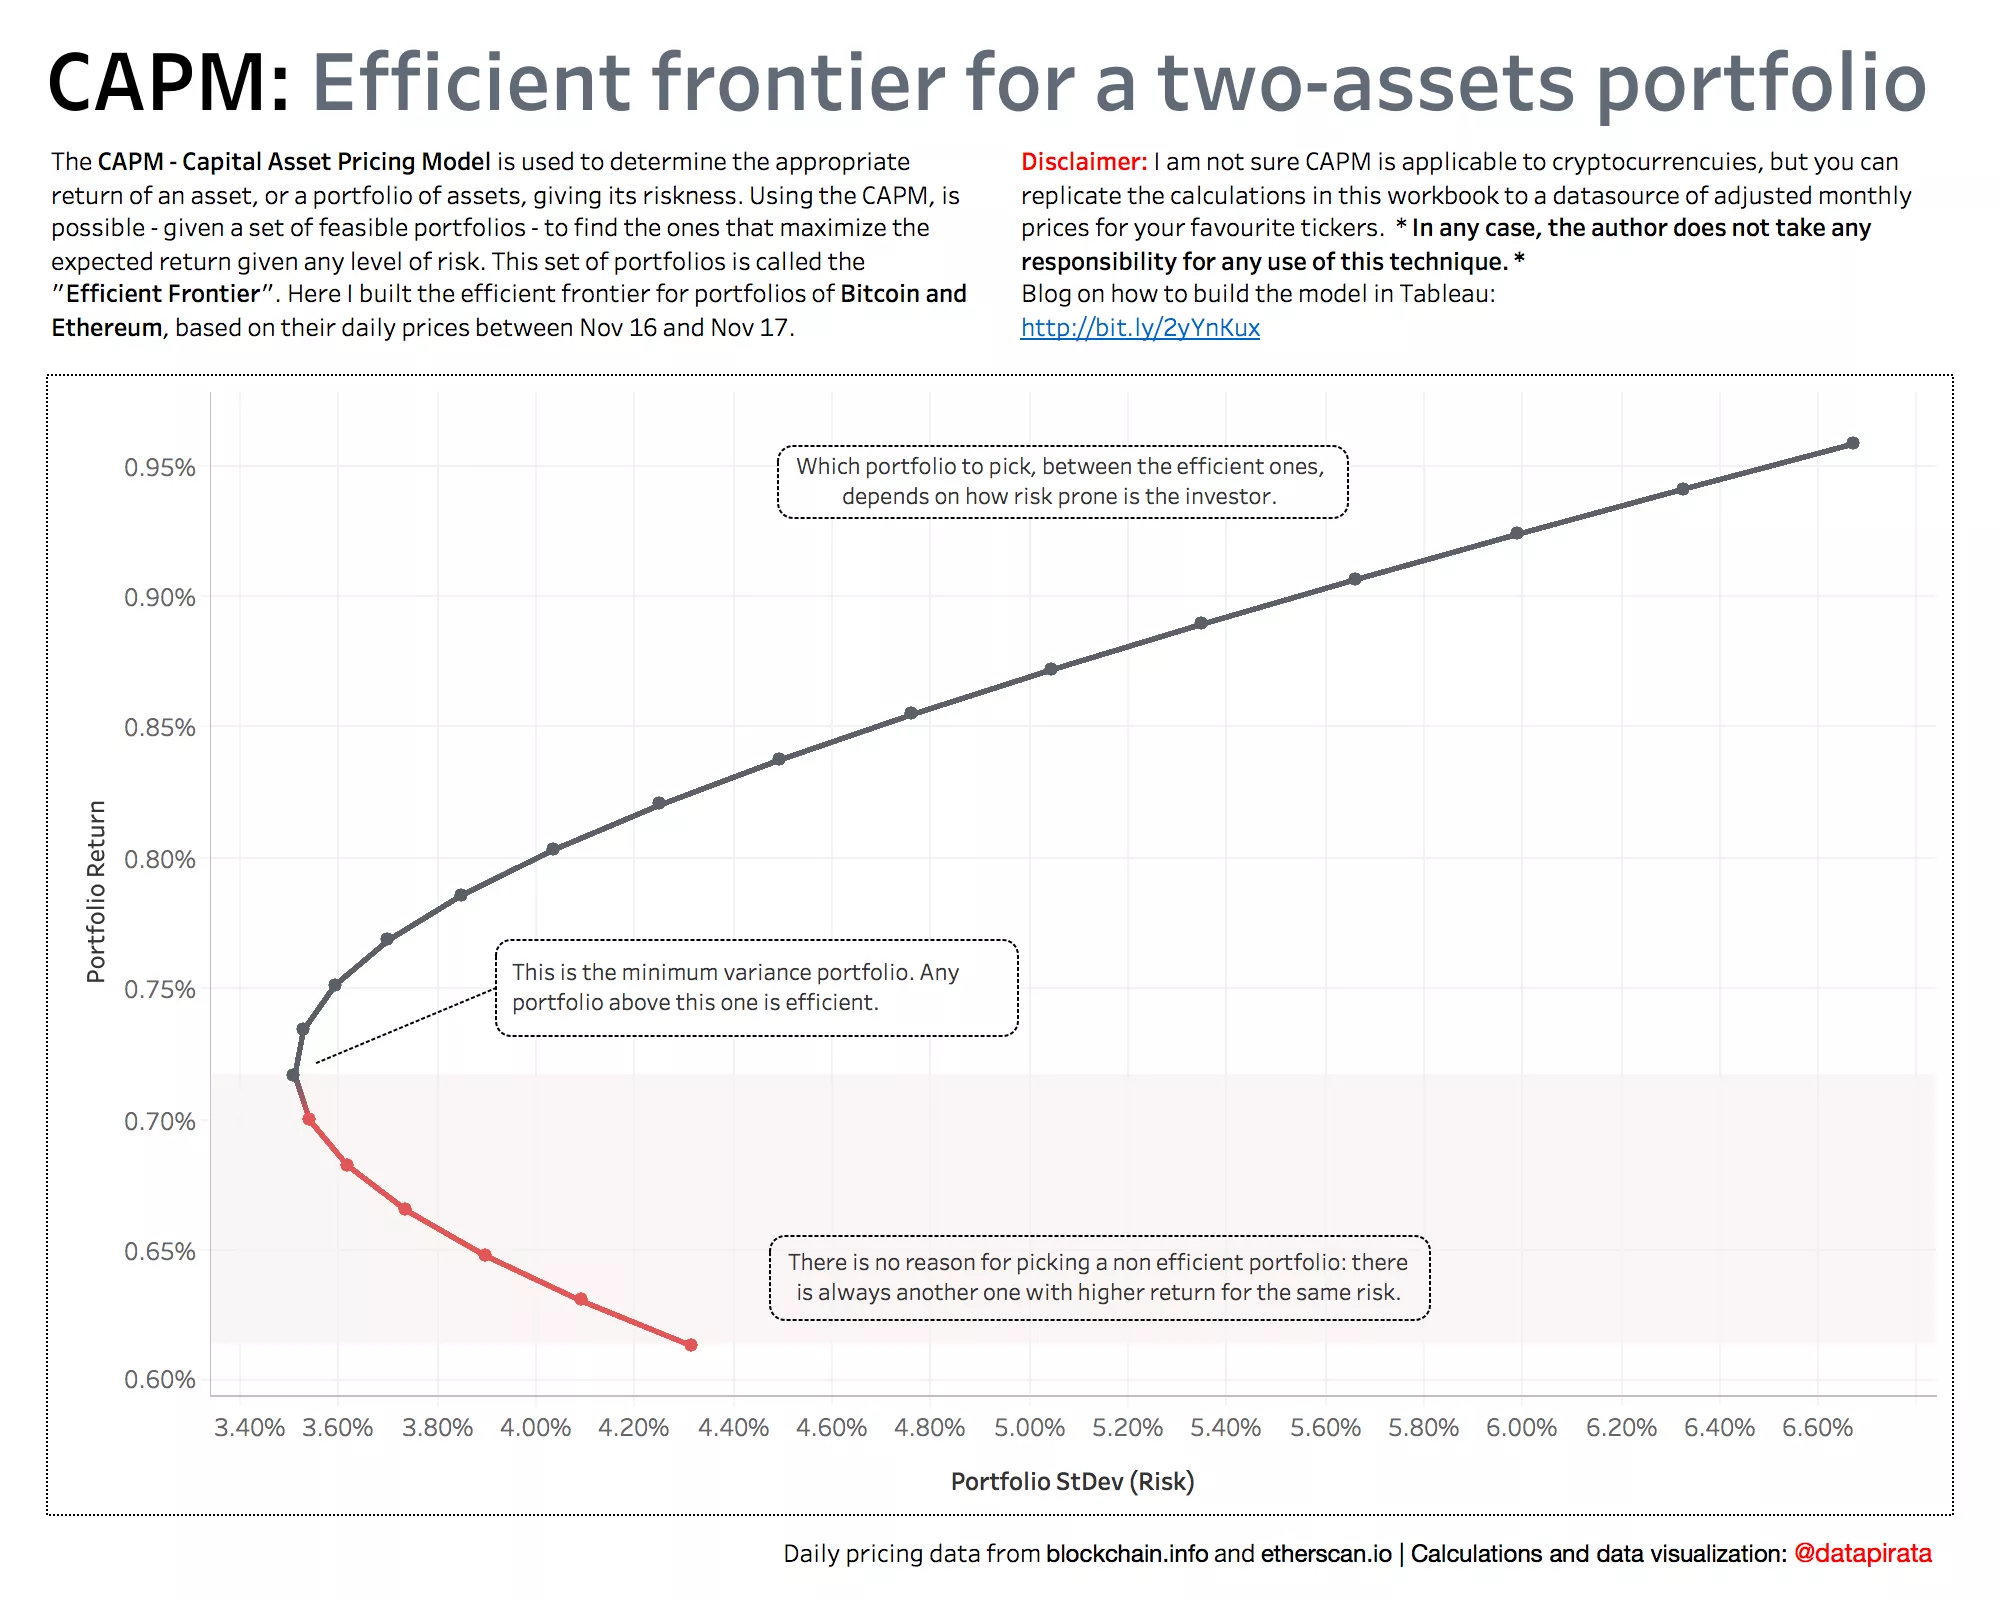
CAPM Financial Model in Tableau: Efficient frontier for a two assets portfolio
This month I am working with financial data, so I thought it was a good idea to refresh my financial mathematics knowledge replicating some simple Capital Asset Pricing Modelling (CAPM)...
A life in black and white
It’s that time of the year again, when Tableau hosts another round of the #IronViz competition. This time the topic is “Safari”: Animals & Plants. After playing around with a...
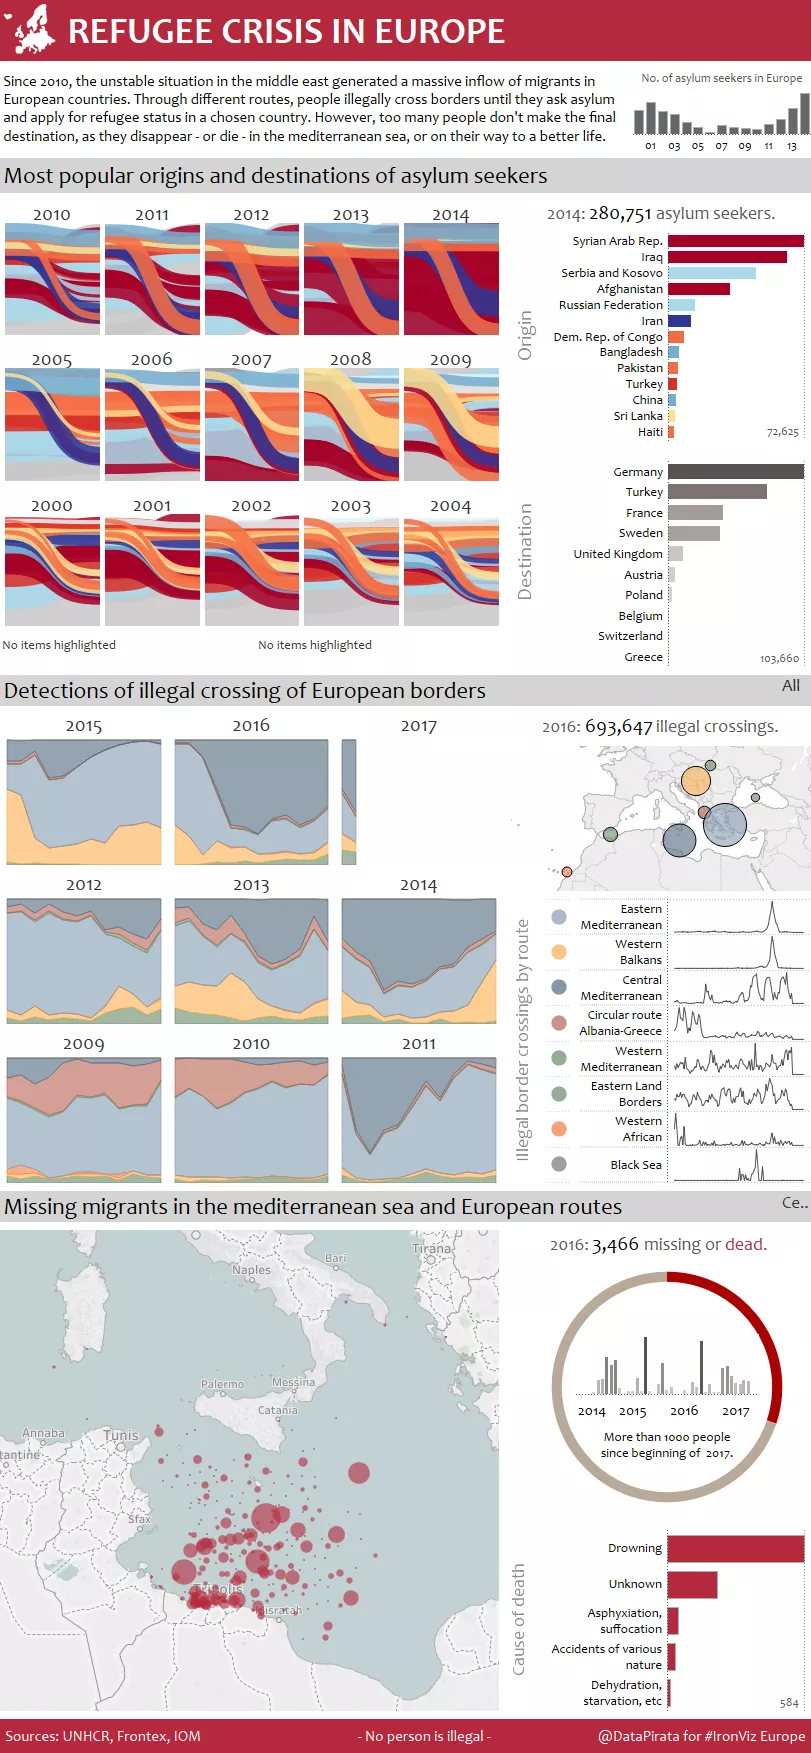
Refugee crisis in Europe - My entry for the European #IronViz competition
Since 2010, the unstable situation in the middle east generated a massive inflow of migrants in all European countries. Through different routes, people illegally cross borders until they ask asylum...