Apollonius tangency problem
Since version 8, Tableau offers a native circle-packing algorithm to produce bubble charts.
Of course, bubble charts are all but best practices when it comes to data visualizations, and dataviz expert Stephen Few even ranted against the software when they introduced this option.
However, despite not being great as a data visualization type, circle-packing is a technique with a long and interesting story.
As it usually happens in math, circle-packing was born in ancient Grece, with the name of “Apollonius’ Tangency Problem”.
Apollonius of Perga was a mathematician born around 261 BC, who showed how to find a circle tangent to any three objects on the plane, including other two circles.
During the centuries, Apollonius’rule was used to draw complex circle-packing shapes named “Apollonian Gasket”, or “Apollonian Net”.
Given three tangent circles, Apollonius discovered how to find other two circles that are tangent to all of the original ones
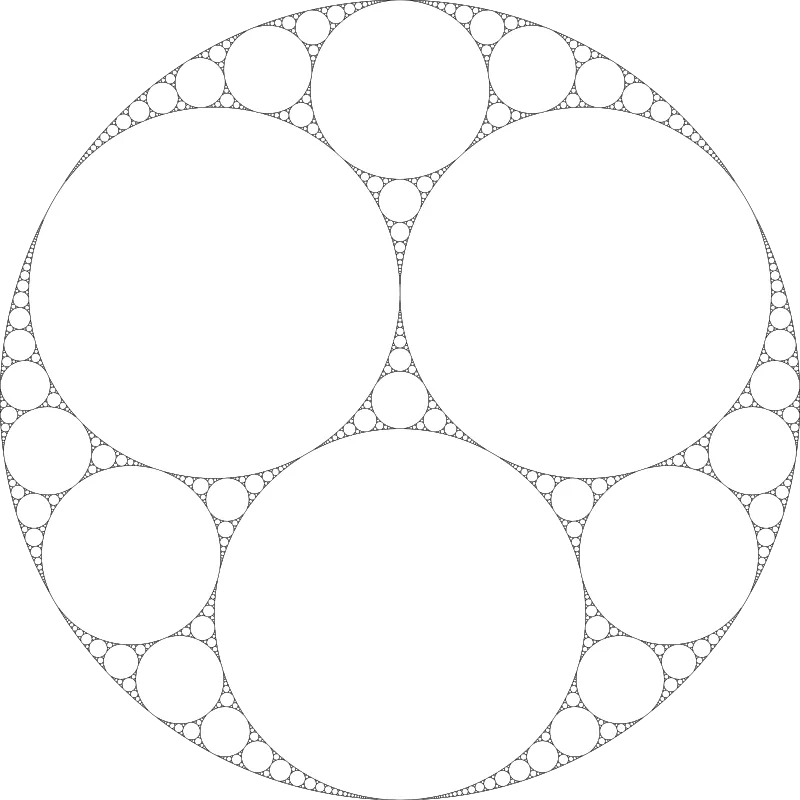
that belongs in the field of maths and algebra, and has been borrowed by dataviz to encode quantities as circles’ area.
that belongs in the field of maths and algebra, and has been borrowed by dataviz to encode quantities as circles’ area.
that belongs in the field of maths and algebra, and has been borrowed by dataviz to encode quantities as circles’ area.
When brought back
If you are interested in the mathematic side of circle-packing, here is the personal web page of an academic expert in the field. My uncle Giorgio did his own research on